Assess the extent to which there are inter relationships between processes in the water cycle and factors driving change in the carbon cycle
Assess the extent to which there are inter relationships between processes in the water cycle and factors driving change in the carbon cycle The water cycle is the continuous process by which water is circulated throughout the earth and atmosphere by evaporation, condensation, precipitation and transpiration. The carbon cycle is an open system but consisting of key sub systems within. These operate as open systems, exchanging and transferring carbon between them and, in doing so affect conditions for all life on earth. The water and carbon cycles are closely intertwined with each other. Both cycles are essential for life on earth. Processes in the water cycle correspond to changes in the carbon cycle. For example, weathering releases carbon back into the atmosphere but it could not happen without water. The water and carbon cycles are both essential for life. Carbon is a fundamental building block of life as all living things contain carbon. All living things also need water to survive. The water and carbon cycle affect most food chains as they are important during the process of photosynthesis in plants which form the base of many food chains. Photosynthesis requires inputs of both the water and carbon cycles. The water and carbon cycles make earths temperatures inhabitable as they regulate the climate. Water is present in the atmosphere as water vapor whist carbon exists
Explain Why the Economic Effects of Hazards Vary Spatially
Explain Why the Economic Effects of Hazards Vary Spatially PLAN Introduction- Define Spatial. -how is spatial linked to hazard (a type of classification), link to economic effects. Middle- Spatial and economic effects in LEDC/MEDC. End- Explain why economic effects vary spatially. Spatial distribution is one of the many types of hazards classification that help the scientist predict the hazards relating to where they are lost likely to occur and the impact it will have. Hazards can been classified by their spatial distribution, e.g. MEDC/LEDC or by continent, or even by tectonic occurrence (e.g. plate situation) or climate region. The definition of spatial distribution links to economic impacts, because it is common knowledge that any major hazards that occur in the LEDC is more likely to have an impact, mainly death toll, and loss of livelihood, land, jobs. All these factors can affect the economic activity of an LEDC country; however the MEDC is more likely to suffer severely from a major hazard, loss of power, means loss of trade, loss of transport means, no trade to local businesses. All these can have an adverse effect on the economic activity of an MEDC country. The first focus in the aim of answering the above question will focus on the economic impact of a hazard occurring in an LEDC. We have established that spatial distribution is defined as a hazard

Volcanic Hotspots Presentation
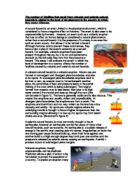
Hotspots By Peter Gadsdon The important point to understand is that the plume is stationary. The point where the hot material breaks out of the mantle and on to the surface stays in the same place. However, where it reaches the surface changes with time, because plates move , as the theory of plate tectonics tells us. Above the hot spot a volcano forms and grows and grows until the plate carries it away. Once the volcano has been carried away and no longer sits over its hot spot, it loses its source of magma. A new volcanic cone begins to form on top of the hot spot. A few active volcanoes do exist in locations well away from any plate margin. These are volcanic hot spots . They may be in the ocean, which is where the best known example, the Hawaiian islands , lies. Others are on land, for example the volcanic region around Rotorua in the North Island of New Zealand. Iceland is unique in that it is a hot spot but is located on a mid ocean ridge. As their name suggests, these are points where molten material from the mantle breaks through the rocks of the Earth's crust to reach surface. They are caused by convectional plumes of very hot magma in the mantle which burn through the crustal rocks to reach the surface. The Hawaiian islands are a perfect illustration of this. All the Hawaiian islands are volcanic. The nearest land is over 3,000 km away. The islands lie on

Japan 2011 Earthquake Case Study
Japan earthquake and tsunami - 2011 ________________ Japan is an island nation located in East Asia. Located in the Pacific Ocean, it lies to the east of the Sea of Japan, China, North Korea, South Korea and Russia. Japan is an archipelago of 6,852 islands. The four largest islands are Honshu, Hokkaido, Kyushu and Shikoku, together comprising about ninety-seven percent of Japan's land area. Japan is a major economic power and has the 3rd largest nominal GDP Its GDP per capita is $34,739 or the 25th highest in the world in 2011 Population is approximately 127 million people, which is the 10th largest population in the world. One of the world’s highest life expectancy at 81.25 years of age. Ageing population with people 23% of the population are over 60 years old fertility rate below replacement level at 1.39 children per woman while the uk’s fertility rate is 1.9 Occurred at 2:46pm Tokyo time on the 11th of March 2011. It was a Magnitude 9 earthquake its amplitude was 100x that of Haiti’s 7.0 Lasted for 3-6 minuets but there were strong aftershocks. The epicentre was 24 km deep, was 72 KM off the coast of sendai. A 400 to 500 km long segment of the north american plate which was being subducted Japan lies at a major triple junction of three major plates which interact in a complex and unpredictable way. The leading edge of the Pacific plate subducts
Why might predicting earthquakes be a near impossible goal?
Why might trying to predict earthquakes be a near-impossible goal? Earthquakes are usually caused when rock underground suddenly breaks along a fault. These sudden releases of energy causes there to be seismic waves, which make the ground, shake. When two blocks of rock or two plates are rubbing against each other, they stick a little, and do not pass smoothly as the rocks usually catch on to each other. The rocks are still pushing against each other, but not moving. After a while, the rocks break because of all the pressure that's built up. When the rocks break, the earthquake occurs. Nowadays, earthquakes are killing more and more people than have ever done before, partly due to the increase in population density in most cities. Last year alone, one million people were killed by earthquakes, and with this number likely to increase in the near future, many argue that we should find a way to predict when these earthquakes occur. Arguably, with such high levels of technology that we have, there must be a way to predict when an earthquake will occur; and he development of being able to do this would be a life saver to many in the future. With the ability to predict earthquakes, governments can make sure that people are evacuated before major earthquakes hits, therefore reducing the impact on human life by the earthquake. So even to this day, the question as to why we still

The World Distribution of Population is as important as the world distribution of areas of tectonic activity in predicting the hazards of volcanic activity. Discuss this statement
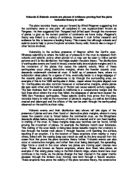
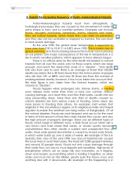
October 23rd �The world distribution of population is as important as the world distribution of areas of tectonic activity in predicting the hazards of volcanic activity�. Discuss this statement (40 marks) A hazard is a danger or risk and a natural disaster deals out a great number. It can be hypothesised that the greatest hazards posed by natural disasters are upon humans, so in knowing where populations are located we can predict the risks of volcanic activity. Hence, it appears common sense would dictate the statement to be entirely true, however, with the addition of a distinction between two arguments it is not always the case. The first states that in a dense area the main hazard is high death tolls, infrastructure loss, famine and epidemics, so distribution of population is vitally important, but the second identifies how in areas of sparse population, other severe effects will occur so population distribution is limited in its predictive advantage; additional effects being those on an international scale, environmental and supply side shocks. Population distribution refers to the patterns of people spread across a given area, often associated with population density (the average number of people per square kilometre). The map below shows how populations are mostly concentrated near coastlines and in habitable environments
To what extent can the theory of plate tectonics explain global distribution of seismic and volcanic activity?
To what extent can the theory of plate tectonics explain global distribution of seismic and volcanic activity? The global seismic and volcanic activity is concentrated along the margins of the earth’s plates, which are broken pieces of the crust and are moved by convection currents that are caused by heat rising and falling inside the mantle generated by radioactive decay in the core. This movement of the plates and the Earth’s inner activity is called plate tectonics and can cause seismic and volcanic activity. However, earthquakes and volcanoes also occur within the plates rather than their edges, an example of which is the Hawaiian volcanoes that occur above a stationary hot spot beneath the Pacific plate. In the late 1960s the theory of plate tectonics was developed by Alfred Wegener and provides an explanation for the Earths tectonic behaviour, particularly the global distribution of mountain building, earthquake activity, and volcanism in a series of linear belts. However, before the theory was developed people had noticed that the continents either side of the Atlantic Ocean seemed to nearly fit together. In 1912 Alfred Wegner published the theory of continental drift suggesting that the continents used to be joined together in an ancient supercontinent which he named Pangaea. He then proposed that it later split in to two continents- Laurasia in the north and

To what extent is magnitude the main factor to influence the type and level of challenge posed by tectonic hazards?
To what extent is magnitude the main factor to influence the type and level of challenge posed by tectonic hazards? Introduction Garret Nagle in 1998 defined a tectonic hazard as “A perceived natural event in the environment which poses a threat to human life and property”. Also adding to this we have a definition of a Natural hazard as “an event or process that has the potential to cause damage to people and their settlements” (Ross, 1998). These two definitions infer that in order for a tectonic process to become a hazard it should happen in proximity of human beings or have a direct impact on them. Following on from this Em-Dat states that in order for a hazard to turn into a disaster it has to meet at least one of these criteria: 10+ people killed, 100+ affected, State of emergency declared or International assistance called for. The aim of this report will be to analyse the effects that Magnitude has on a tectonic event and if it is the most influential in determining the impact of the event. I will do this by analysing relevant case studies where magnitude seemed to play influential role and weather it was the main factor in the disaster. The two case studies that seem to stand out are Japan 2011 and Haiti 2010 as both where hit with different magnitude earthquakes but the impact it had varied considerably. In determining if magnitude is really the main

Hurricane Dean Report
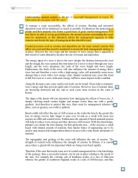
Hurricane Dean report Name of event Hurricane Dean Where and when it happened Hurricane Dean formed on the 13th of August 2007 and eventually fully dissipated on the 23th of August. The hurricane formed over the Atlantic ocean and eventually increased in power and strength over the Caribbean sea. It eventually passed through the south of Jamaica, causing huge problems within the farming society and damaging small towns and villages spread across the country. However the hurricane also had very minor effects on countries such as Puerto Rico, Hispaniola, Cuba, Cayman Islands, Nicaragua, Honduras, Belize, Guatemala and Mexico as it passed through these countries. However the vast majority of the damage was caused in Jamaica. What caused it to be an extreme weather event Firstly, Hurricane Dean was the strongest tropical cyclone of the 2007 Atlantic hurricane season, scaling in at ‘5’ on the Saffir-Simpson hurricane scale during its peak strength. It also reached up to a max wind speed of 175mph for a sustained time of around one minute. It was also measured on its cost in damage to the countries that it effected, reaching a total of around $1.6 Billion. Hurricane Dean was also recorded to be the 7th most powerful hurricane within the hurricane seasons, coming out with the same recorded strength as hurricanes Mitch and Camille. Key impacts on people/human activities To

Explain why many scientists believe that human rather that natural causes may be more to blame for recent climate change
AS Geography Rosie Austin Explain why many scientists believe that human rather that natural causes may be more to blame for recent climate change (15 marks). Evidence of recent climate change is unambiguous. It is true that throughout history climate change has appeared to be cyclical, which we can see on a geological timescale, dating as far as 400 thousand years before present. This timescale shows that climate has always fluctuated as part of a cycle and in many years there have been some periods that are even warmer than the present. This scale shows higher than average temperatures on a long-term basis. A medium term, historical timescale also supports this as it clearly displays cooler and warmer periods, such as a medieval warm period from 1000-1400, and the ‘little’ ice age between 1400-1800.This trend occurred even before the industrial revolution. On studying a shorter term, more recent timescale however, it is clear that such a rapid increase in such a short period of time is an unprecedented phenomenon. The period from 1950-2000 in the northern hemisphere was the warmest 50 year period for 1,300 years, more notably so as such a rapid increase occurred in such a short space of time, whereas previously this change has taken place over thousands of years. It was during this period that 11 of the world’s hottest years occurred since 1850.